
Skip to content

The product

Every machine on one web platform. And in your pocket.

Flowtics is three parts that work as one: Flowtics Edge reads your machines, the web platform is where your team sees and runs everything, and the mobile app and alerts keep the right people in the loop.

Real Flowtics screens. Only the machines and customers are sample data.

Flowtics · Every machine
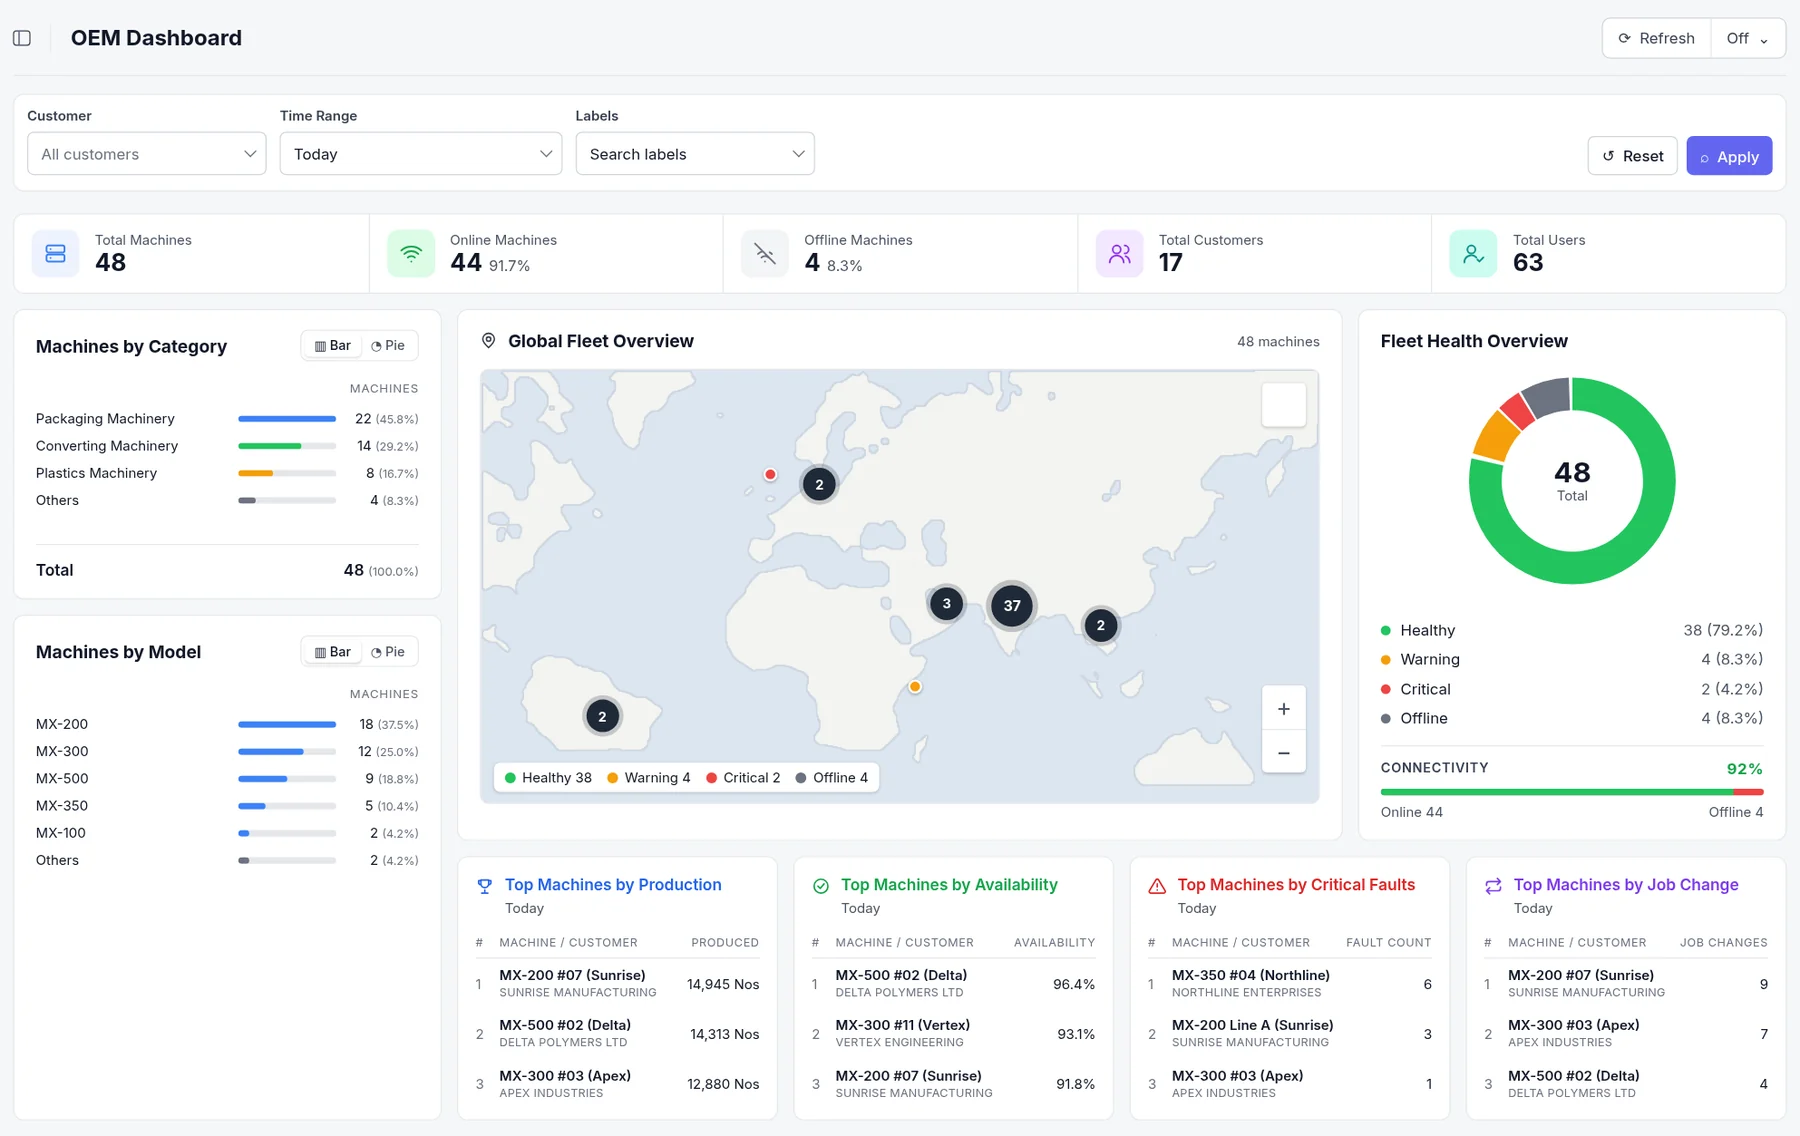
Flowtics all-machines dashboard: machines online, machines by category and model, a world map of where machines are installed, machine health, and the top machines by production, availability, faults and job changes.

What you get

Three parts, one product.

The web platform is where your team works every day. Flowtics Edge feeds it, and the mobile app carries it to wherever your people are.

Flowtics · Alarms
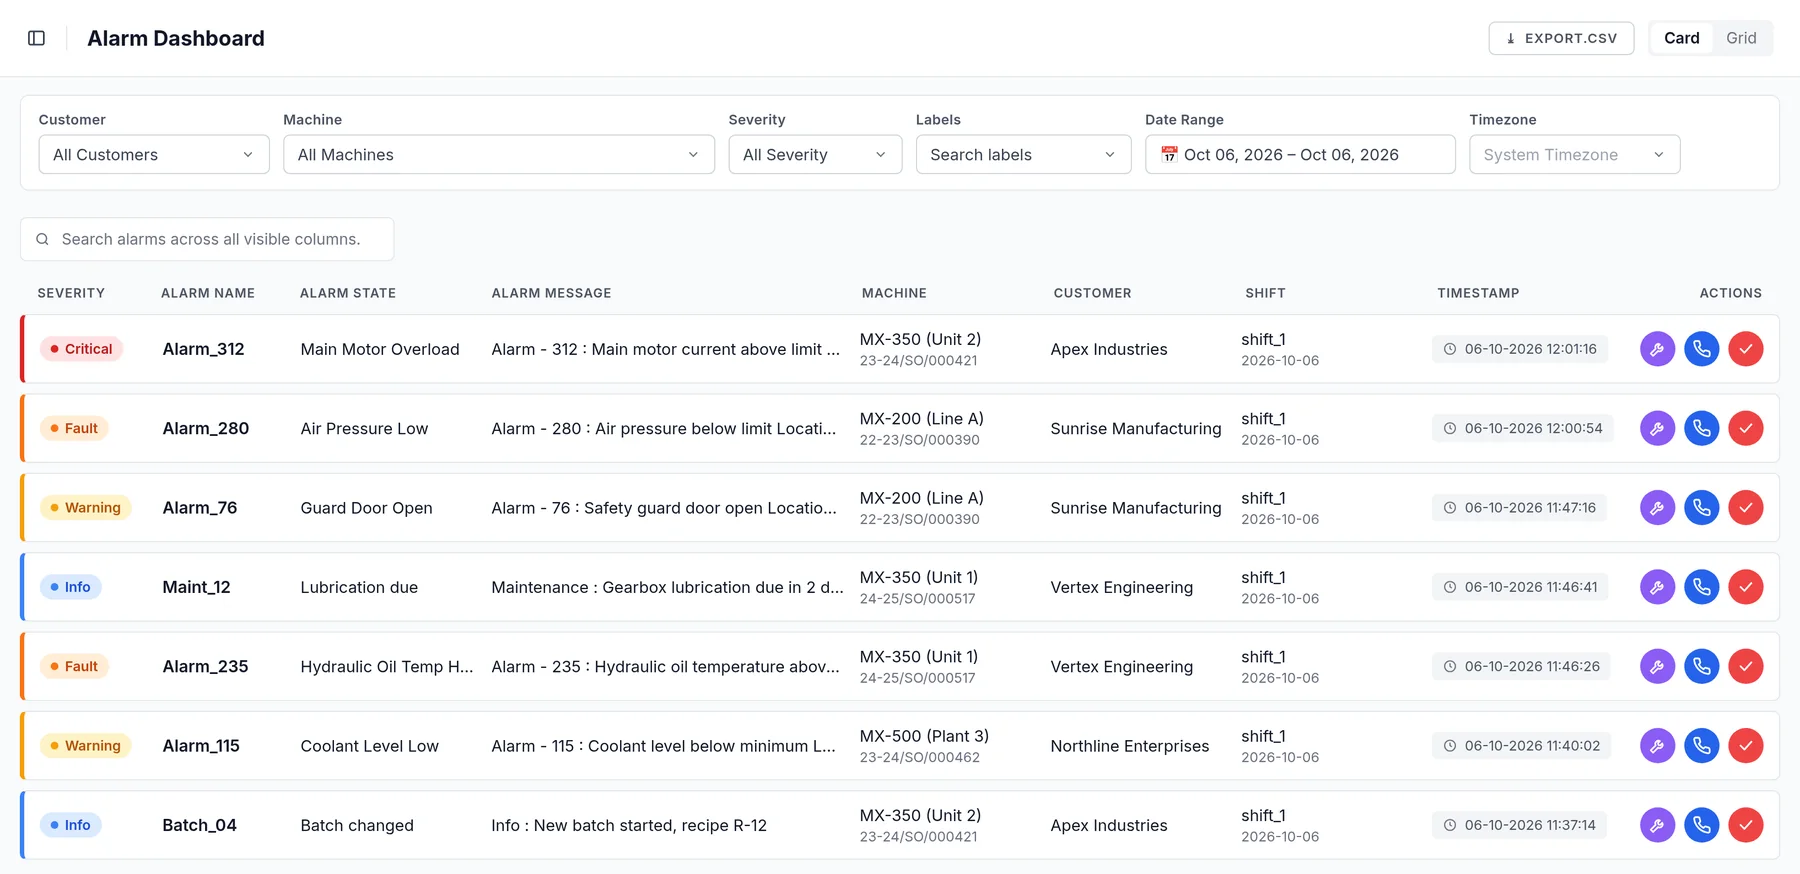
The alarm list of the Flowtics web platform.
1 · In your browser

Flowtics web platform

Live dashboards, alarms, reports, maintenance and the AI analyst, for every machine. It is also where you set things up: add a machine, a reading or an alarm, and the change reaches the machine on its own.

  • Full history, to the second
  • Live widgets, no refresh
  • Our cloud or in-house
See the screens
MX-200 · HMIAUTO
RecipeAlarmsTrendsManualFlowtics Edgerunning
PLC connected · S7-1200
2 · At the machine

Flowtics Edge

Software on the HMI or panel PC already on your machine. It reads the PLC, decides alarms in under a second and buffers data if the internet drops. No HMI or PC? We add a small Raspberry Pi.

  • Siemens S7
  • Modbus
  • OPC UA
  • +8 more
How it works
3 · In your pocket

Mobile app & alerts

The same machines on your phone, with the AI analyst one tap away, plus alerts on WhatsApp, SMS, email or app notification. Each person picks how they hear, and sees only the machines they look after.

  • Android & iPhone
  • WhatsApp · SMS · email · push
  • AI analyst built in
  • Your brand on it
Meet the AI analyst

The screens

Click through what your team will use.

Real Flowtics screens with sample data.

Every alarm, and one click to the whole story.

  • Filter by machine, customer, severity and date
  • Open any alarm: downtime, location, component, and live data from the moment it happened
  • Remedy, call list and acknowledge, on the row or inside the alarm

Used by Operator · Maintenance · Service team

Alarm dashboard
Alarm DashboardAll customers ▾All machines ▾All severity ▾Today ▾
SeverityAlarmMachineCustomerShiftTime
  • ● CriticalAlarm_312Main Motor OverloadMX-350 (Unit 2)23-24/SO/000421Apex IndustriesShift B14:18:40
  • ● WarningAlarm_76Guard Door OpenMX-200 #03 (Rajkot)22-23/SO/000388Sunrise ManufacturingShift B14:05:12
  • ● InfoMaint_12Lubrication dueMX-350 (Unit 1)24-25/SO/000517Vertex EngineeringShift B13:58:27
  • ● WarningAlarm_115Coolant Level LowMX-500 (Plant 3)23-24/SO/000462Northline EnterprisesShift B13:40:02

↑ Tap or click Alarm_280 to open it

Everything it does

Everything your team needs. Nothing they have to type.

See

Know how every machine is doing, without asking anyone.

Live dashboards

Drag and drop from 20+ widgets, including live OEE. The operator, the maintenance head and the MD each get their own screen. No code.

Reports nobody types

Machine analysis, on/off times, incidents, maintenance and every alert sent, straight from the platform. As PDF or Excel, emailed on schedule.

Any language

English, हिंदी, ગુજરાતી, Français or any other. Your customers abroad see screens in their own language.

Ready-made dashboards

  • All machines overview
  • Alarms
  • Shift-wise
  • Job-wise
  • Day-wise
  • Reel-wise
  • Energy
  • Connectivity status

Built-in reports

  • Machine analysis
  • Machine on/off
  • Incident report
  • Maintenance schedule
  • Notification history
  • Activity log

And more, or build your own dashboards with drag and drop.

Act

Get the right person moving, with the fix in hand.

Alerts people actually read

WhatsApp, SMS, email and app push. Your admin sets which alarms each person gets, and on which channel. Unanswered alarms escalate.

Remedies & call list

Your team writes the fix for each alarm once, so every engineer and operator can follow it. One tap calls everyone listed for that machine.

Maintenance on time

Schedules by running hours, production count or calendar, down to each component. Reminders reach the right person before it's due.

Incident log

Operators log issues with photos, tied to the exact machine and time.

Control

Stay in charge of who sees and changes what.

Write back, with permission

Change a setpoint from the platform when you choose to. It's off by default, allowed point by point, and every command is logged.

Connects to your systems

A REST API sends machine data to your ERP, MES or BI tools.

Access & audit trail

Role-based access for your team, your customers and their operators. Every change is versioned, logged and can be rolled back.

For machine builders

Run it as your own service for every customer.

Flowtics for machine builders

Your brand

The whole web platform and the mobile app carry your name and logo. Your customers never see ours.

Every customer, one view

All your customers and their sites in one place. Each customer sees only their own machines, and only what you allow.

Book a free visit

See what your own machines can already tell you.

Half a day at your works and an honest written answer. No cost, no obligation.

What happens on the visit

  1. 01
    We come to your works

    Half a day. We look at two or three of your machines and their PLCs.

  2. 02
    We check what Flowtics can read

    Which readings, alarms and counters it can pick up, and what they would show you.

  3. 03
    You get a written report

    With your own numbers. Then you decide: stop there, or start a pilot.

  • No cost
  • No obligation
  • No technical preparation